The question
A decision is good if it has positive expected value given what you knew when you made it, not because it happened to win. Poker players call the opposite habit results-oriented thinking. I wanted to measure how misleading results are: if a strategy has a real edge, how often does a short stretch of play still show it losing?
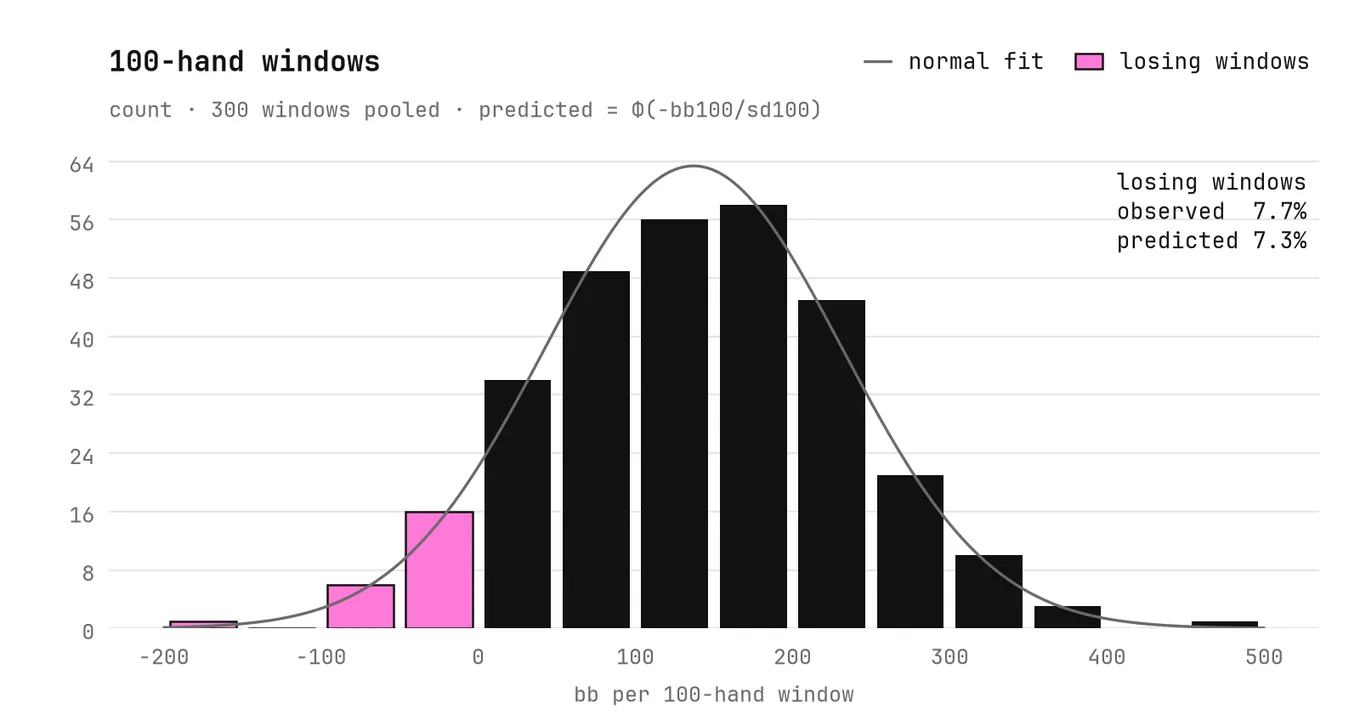
The mathematics gives an exact answer. Winnings are a random walk with a drift (the edge) and a step size (the luck). Over n hands the edge grows like n and the luck only like √n, so the share of 100-hand stretches a winner loses should be Φ(−win rate ÷ standard deviation), with both measured per 100 hands.
What I ran
Two agents played heads-up fixed-limit Hold’em on a Raspberry Pi 5.
- The math agent estimates its chance of winning by Monte Carlo (6,400 trials per decision) and calls only when that beats the pot odds. It never bluffs.
- The vibes agent decides by a crude “this feels good” check plus a coin flip.
- Before any data existed I fixed the game, both agents, the metrics and the rule for judging each hypothesis.
- A 1,000-hand pilot then produced predictions, written down as ranges, for three main runs of 10,000 hands each.
What happened
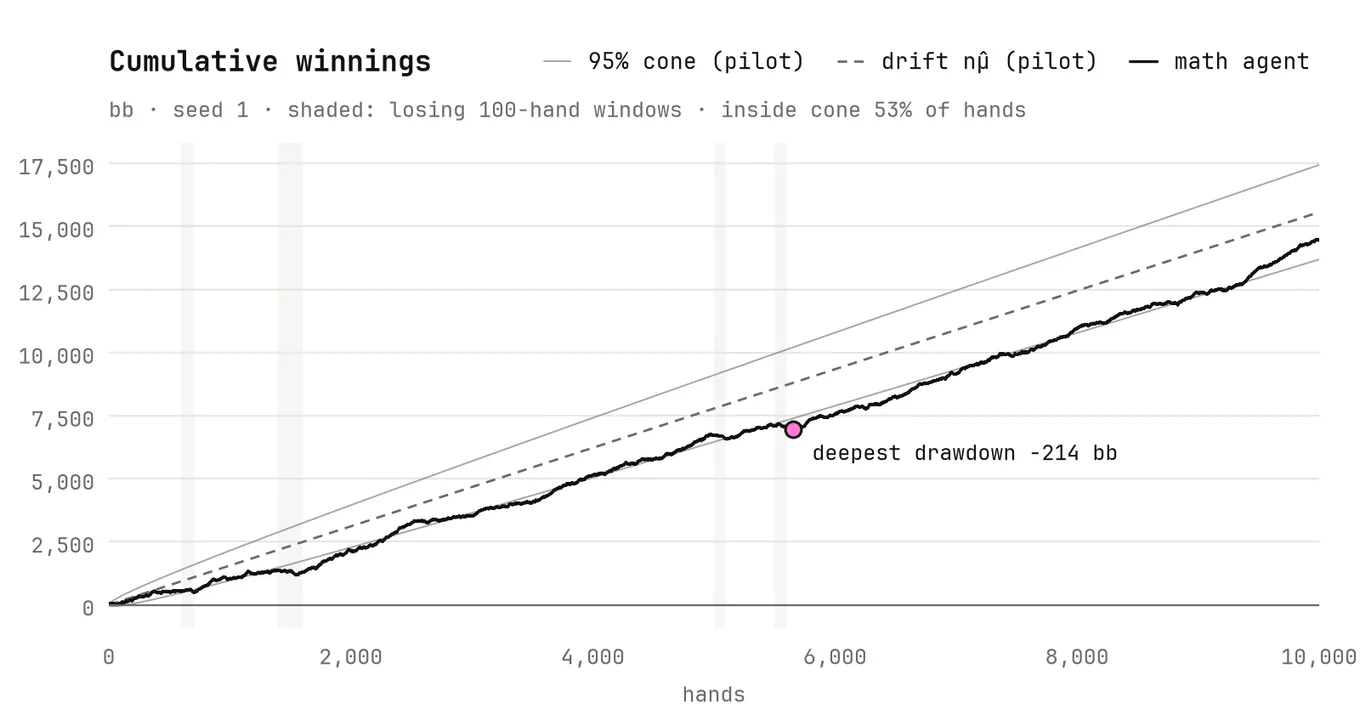
The edge was real: the math agent won 137 big blinds per 100 hands. It still lost 23 of its 300 hundred-hand stretches, 7.7%, against 7.3% predicted by the formula. Both pilot predictions landed inside their ranges.
One of my three hypotheses failed. I had expected the edge to hide often, in at least 20% of stretches. It didn’t, because the vibes agent turned out far weaker than I assumed. The pilot showed this before the main runs. I recorded it and left the opponent alone, since tuning it to rescue the hypothesis would have been the results-oriented move the project argues against.
- Dealing every deck twice with the seats swapped cancels most card luck. It cut the variance of the estimate by 4.3 times.
- The pilot’s 95% forecast cone held the real path only 53–82% of the time. The cone covers luck, but not the error in the pilot’s own estimate of the edge.
Why it matters for trading
The same arithmetic describes any strategy with an edge. Win rate is mean return, standard deviation is volatility, and their ratio is the Sharpe ratio.
- A strategy with an annual Sharpe ratio of 1 loses about 39% of its months.
- It needs about four years of results before its record can be told apart from luck at 95% confidence.
- With an edge as small as real ones are, the formula says a winning poker player loses 46% of 100-hand stretches.
Limitations
- The opponent is weak and simulated, so the size of the edge does not carry over to real play.
- The math agent assumes its opponent holds a random hand. That fits an opponent who plays nearly everything and would fail against a careful one.
- Fixed-limit betting with a cap keeps every result bounded, at the cost of realism.
My role
I did this on my own, from the question to the write-up. I designed the experiment (the game, both agents, the hypotheses and the rule for judging each one), built it with Claude Code as my coding agent, ran it on my own Raspberry Pi and analysed the results. The concepts and formulas come from MIT OpenCourseWare’s 15.S50 Poker Theory and Analytics.
What’s next
A rerun against a stronger opponent, where the edge is small enough to hide.